
You are here
Consumer Data Insights for Housing Policy
CDRC researchers produce new indicators for understanding local population and housing market dynamics.
Solving Britain’s housing crisis requires rich, robust and regularly updated local data about the housing stock and how people move through it. However no traditional data resource ticks all these boxes. For example, the census is comprehensive but only done every decade whereas social surveys gather rich data but rarely interview enough people to allow local patterns to be studied.
A team of CDRC researchers aimed to overcome these issues by harnessing consumer data to create new indicators of population mobility dynamics and housing consumption across the UK. These indicators and the insights they support were showcased at a stakeholder workshop in June.
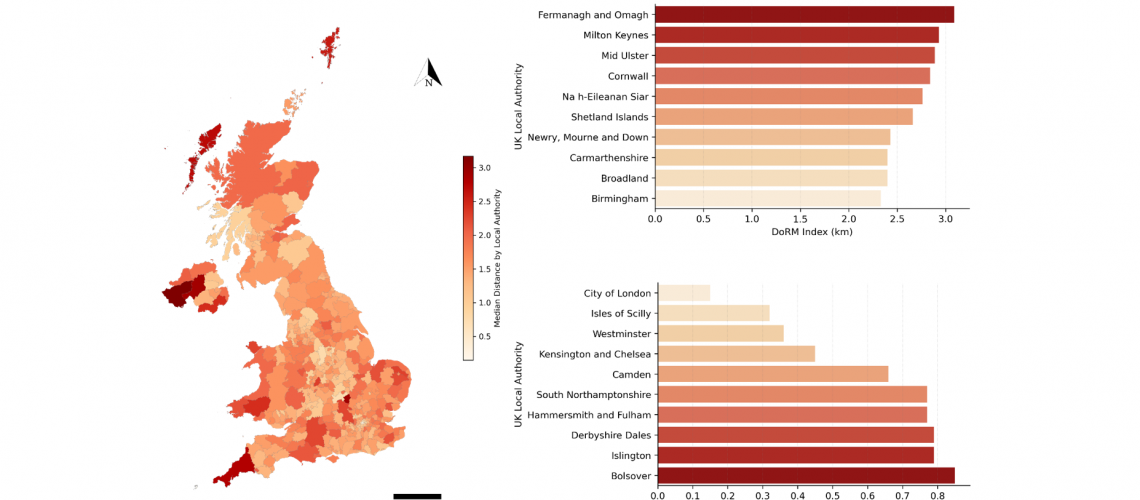
One strand of research, led by Dr Meixu Chen, involved the creation of a Distances of Residential Moves (DoRM) Index for UK local areas. The DORM index has been compiled from CDRC Secure Linked Consumer Registers (LCRs). These contain annual updates of the names and addresses of a large proportion of adults living in the UK from 1997 onwards.
The first analysis step was to use name and address information to estimate when individuals moved between UK addresses from 1997 onwards. After geo-referencing the origin and destination address for each move it was then possible to calculate the DoRM index. This provides yearly estimates of the median straight-line distances of all known residential moves to, from and within each UK local authority between 1998 and 2020.
The map below shows estimates of the median distances of all known residential moves within each UK local authority that took place between 1997 and 2020. Longer distances are visible in Northern Ireland, the Highlands, Wales and more rural parts of southern England. The plots show the 10 local authorities with the highest (top) and lowest (bottom) DoRM index values. Similar ranked lists can be calculated for other types of move, for specific periods of time and at different spatial scales.

Left: Distance of internal residential moves by local authority, right: 1) top: highest and 2) bottom: lowest 10 median distances moved within local authorities, 1997-2020.
Another strand of work led by Dr Meixu Chen involved generating a Residential Mobility and Deprivation (RMD) Index for UK localities. The RMD index summarises the average changes in deprivation that occurred when people move into, out of or within each local area every year from 1998 to 2020. It has been compiled by taking data on the origin and destination neighbourhoods of all residential moves estimated from CDRC’s LCRs.
The deprivation ranks of these neighbourhoods recorded using varying timestamps of UK Indices of Multiple Deprivation have been converted to national percentiles for the four countries of the UK, with the RMD recording the average change in deprivation percentile that occurs with different types of residential moves. A positive index value indicates moves generally carry people to less deprived neighbourhoods while a negative index value signals the opposite. The index enables us to examine whether incoming residents originate from more or less deprived neighbourhoods and thereby can provide insight on processes like gentrification or population displacement.
The figures below show the 10 local authorities where in-movers (left) and out-movers (right) experienced the greatest improvement in their neighbourhood deprivation over the 1998-2020 period. Deprivation levels improved significantly when people moved into areas such as Rushcliffe, East Renfrewshire and Wokingham and moved out of localities such as Kingston upon Hull, Nottingham, Hackney and Leicester.

The 10 local authority destinations (left) and origins (right) for which in-movers and out-movers experienced the greatest improvements in social deprivation, 1997-2020.
Finally, work conducted by Bin Chi under the auspices of the Modelling Housing Careers in Great Britain project has shed light on the housing space consumption of households across Britain. Bin has geo-referenced open data on dwelling space (in square metres) from the domestic Energy Performance Certificates logged with the Ministry of Housing, Communities and Local Government. By linking this data to addresses the Linked Consumer Registers estimate to have been occupied by migrants moving in, out and within local authorities, we can glean a better understanding of how housing space consumption varies geographically when people move.
Below we can see the median housing space (total floor area in square meters) consumed among people moving into each London local authority in 2012 from (Figure 1A) other London local authorities and (Figure 1B) from outside London. Estimates of dwelling space consumption can also be produced at other geographic scales and for any year between 2012 and 2020.

An online dashboard showcasing the data resources described in this story can be accessed at https://public.tableau.com/app/profile/cdrc/viz/CDRCHousingDashboard/CDRCHousingDashboard.
Many of the datasets used in this story can be downloaded from https://data.cdrc.ac.uk.