You are here
When do people get tested and does it matter?

Testing has become a way of life as we begin to learn how to live with COVID-19. We have previously described who got tested when initially piloting the provision of free lateral flow tests. Testing has ramped up since that pilot and has become a more common feature of many parts of our lives including work, education, leisure or visiting friends/family. In this data story, we describe national patterns in how people have engaged with testing, including: How do testing behaviours vary across the day and week? Are positive cases of COVID-19 more common at particular parts of the day or week?
To answer these questions, Simon Leech and Mark Green from the Local Data Spaces team [1] examined the records from 64,352,735 COVID-19 tests taken upto 8th April 2021 from NHS Test and Trace data [2]. NHS Test and Trace data contain information on all tests conducted and reported in England and Wales and therefore gives us the best idea of what has happened in England and Wales.
How does testing vary by time of day?
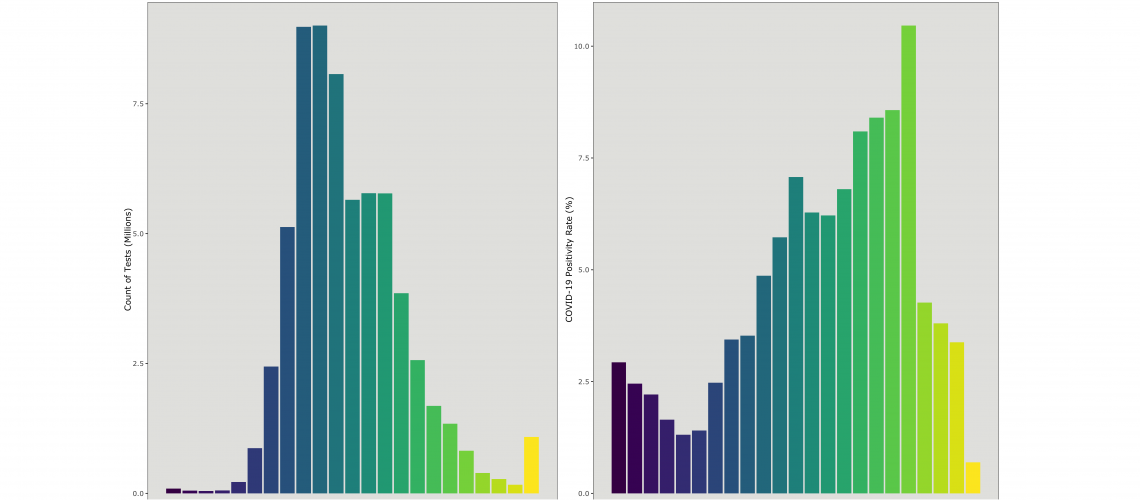
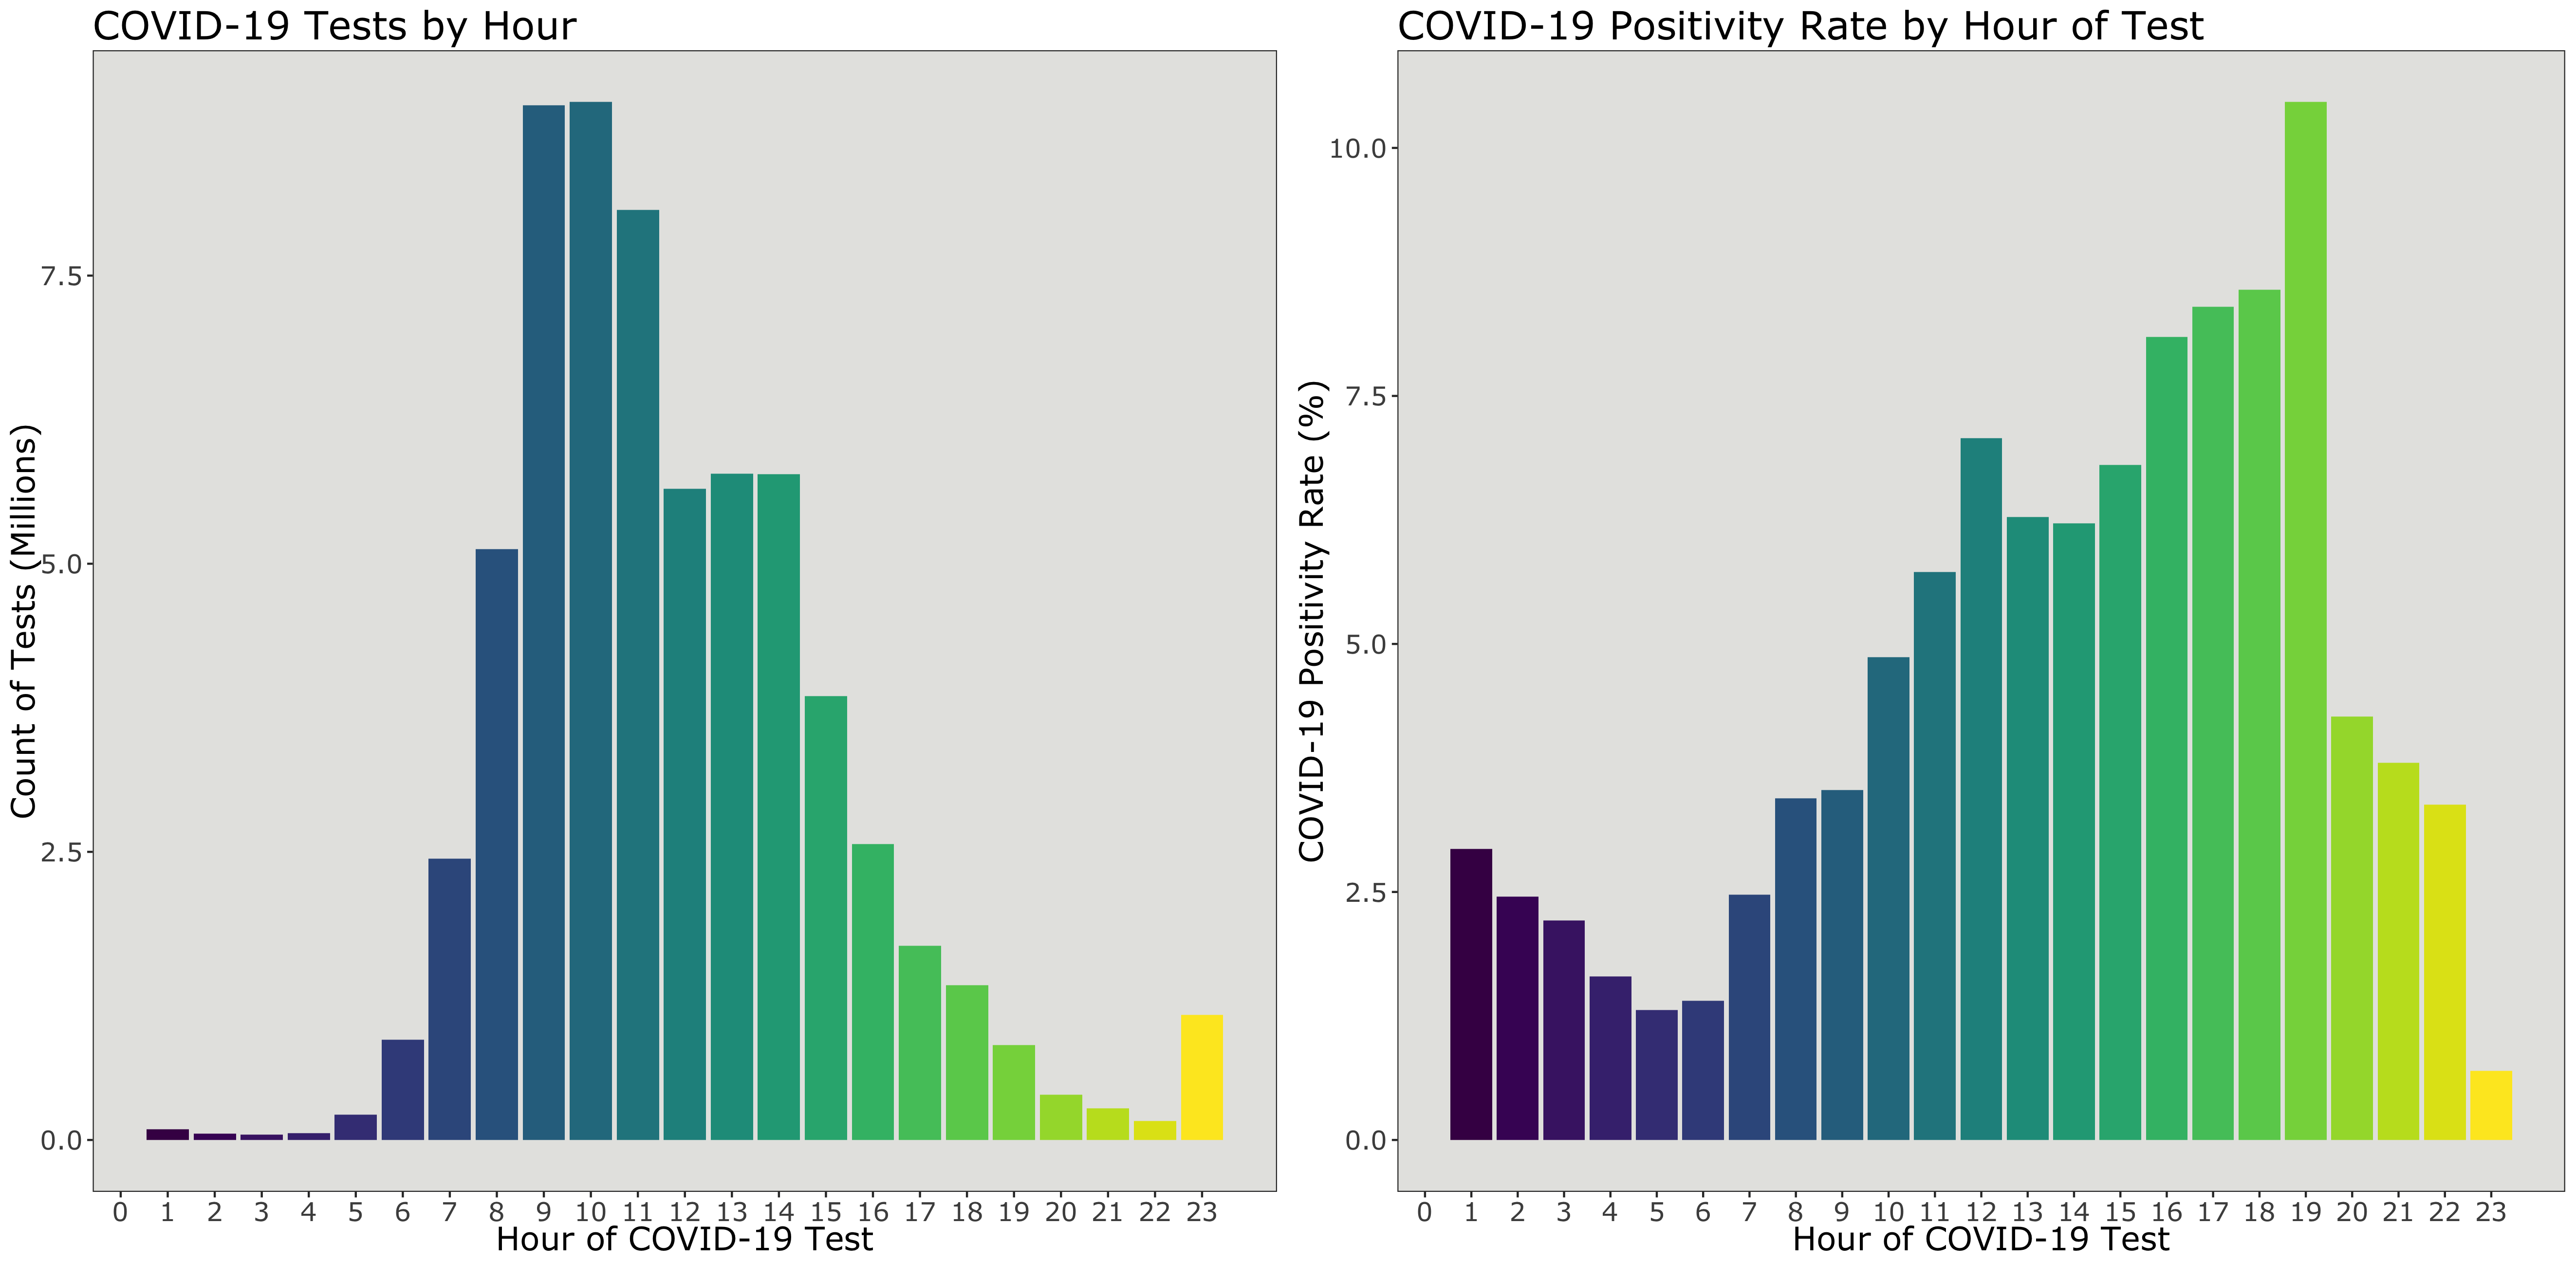
Testing was most common between 8-10am in the morning (see Plot 1a), reflecting higher demand for tests to enable people to return to work. This morning peak most pronounced midweek and was not as strong on the weekend. Testing declines from 14:00 onwards. A small peak between 23:00 and 23:59 likely reflects erroneous data points, coded to the end of the day.

Plot 1: Test uptake (a) and test positivity (b) by time of day.
Examining the percentage of tests that were identified as positive for COVID-19 showed increasing positivity through the day (see Plot 1b), with the highest percentages in late afternoon to early evening. This follows evidence from the US that viral shedding of coronavirus is largest during the afternoon, suggesting that encouraging people to get tested in later in the day may be preferable.
How does testing vary by day of week?
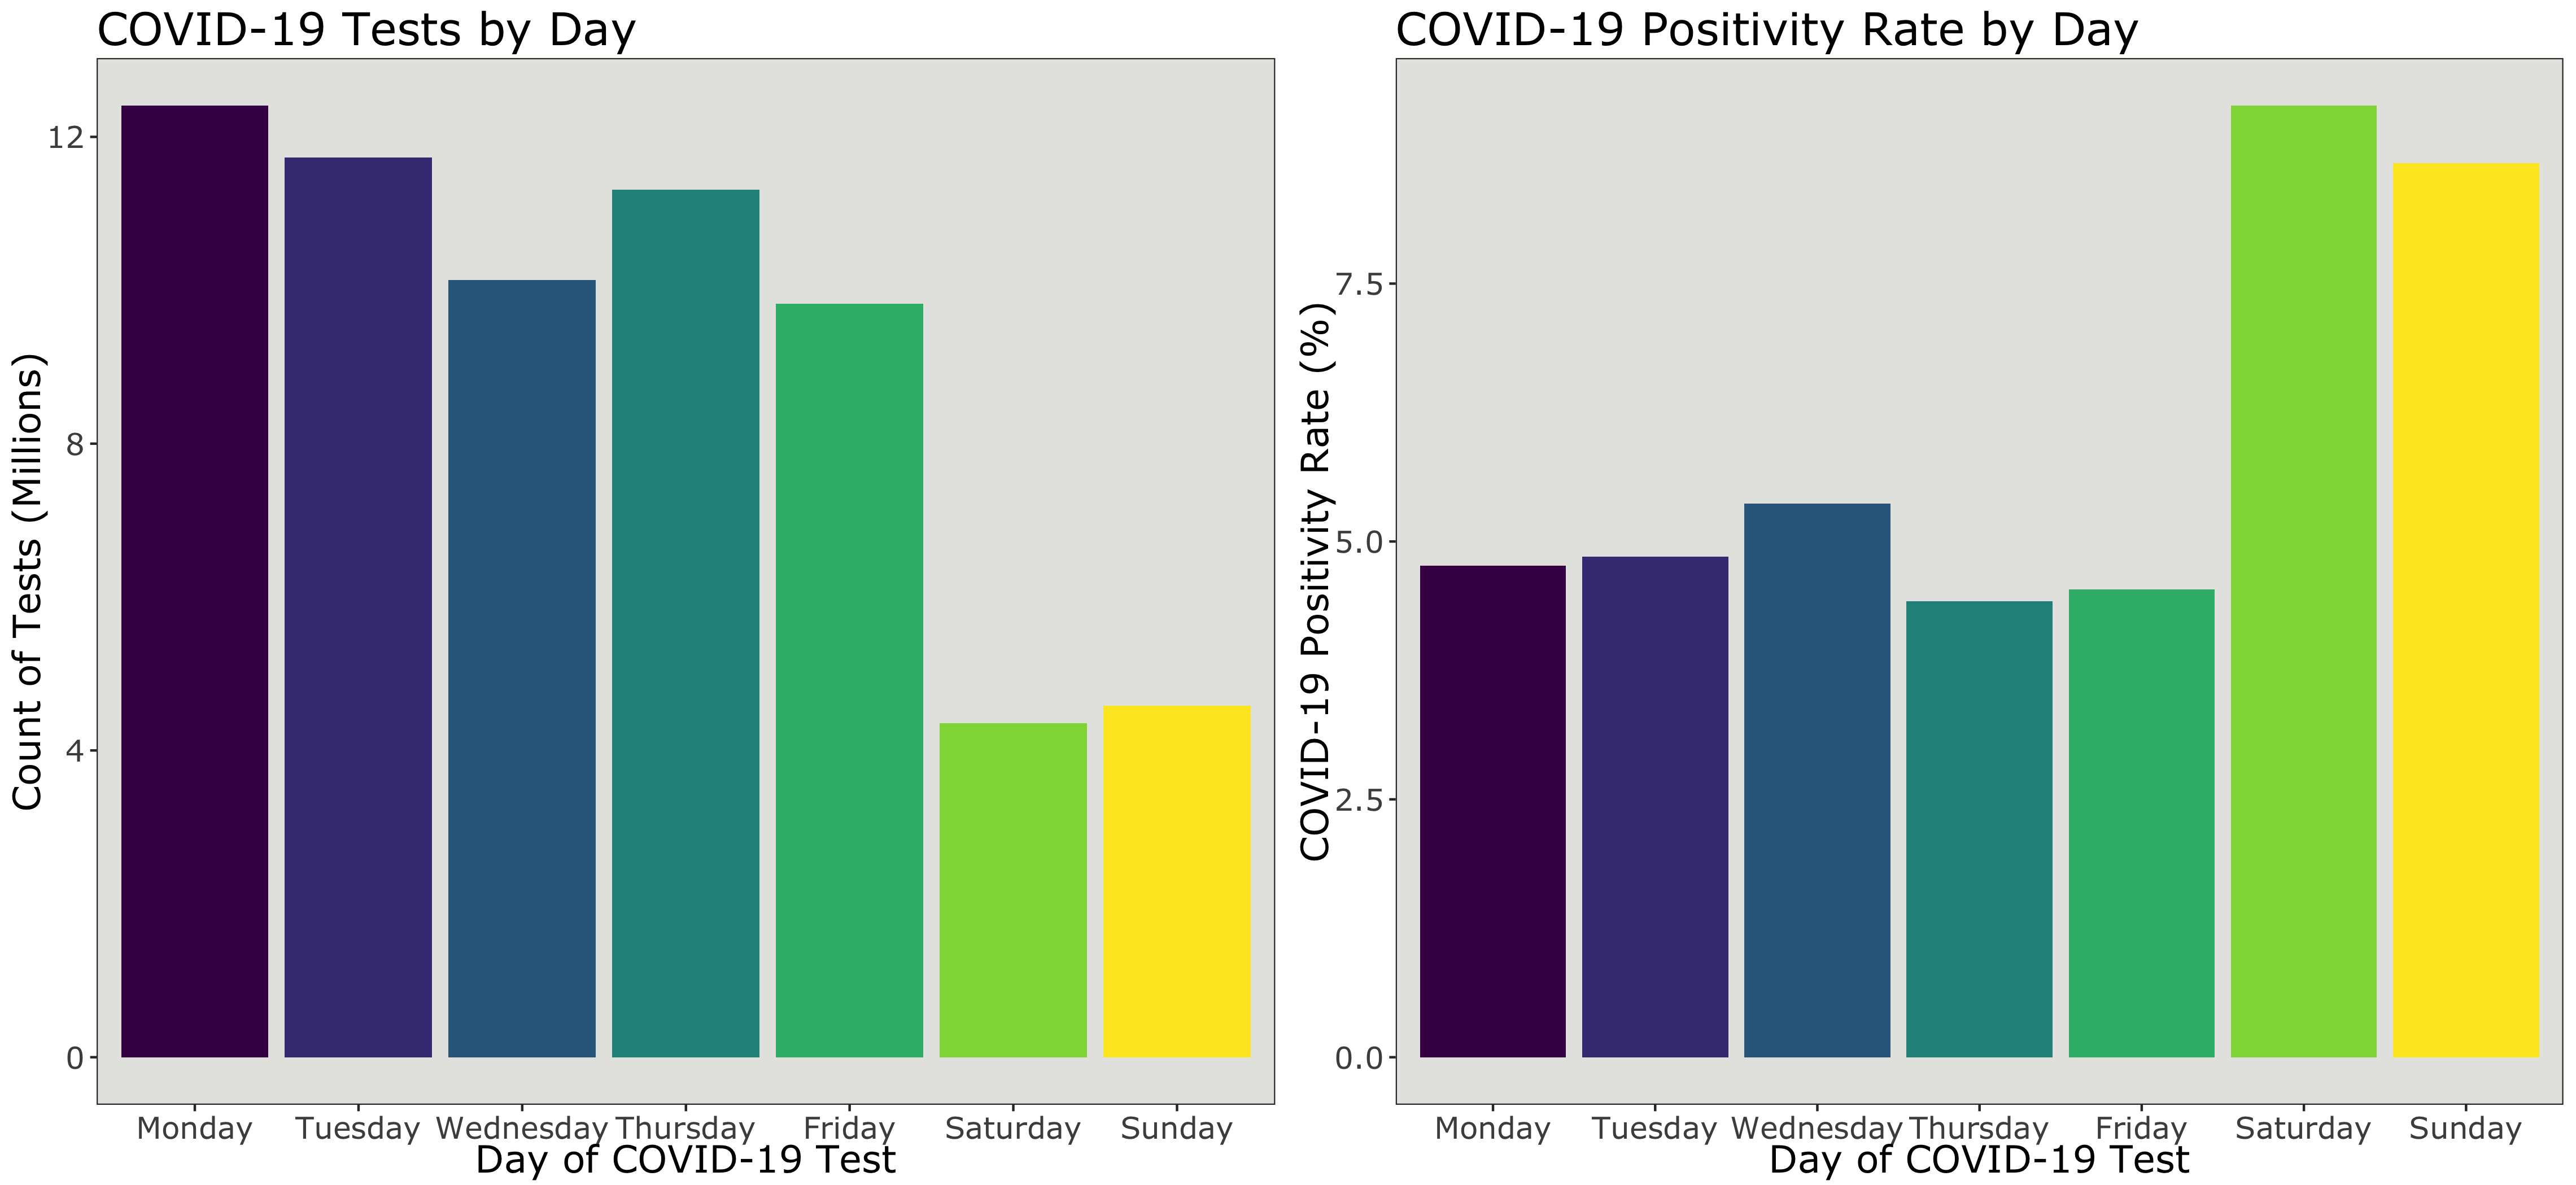
Testing was highest between Monday and Friday (see Plot 2a), with a small decline through the week. Again, this reflects the dominance of testing related to work or of school children, including recommendations to get tested multiple times during the week. There is then a large drop off of testing over the weekend.

Plot 2: Test uptake (a) and test positivity (b) by day of week.
The pattern for the percentage of tests that were positive for COVID-19 is the opposite of testing uptake patterns (see Plot 2b). Positivity rates were 1.86 times higher during the weekend, than compared to the week, with values of 4.78% and 8.94% respectively. With fewer tests conducted on the weekend, this may reflect that individuals were more likely to get tested due to worries over symptoms, rather than to access work or education.
Summary
COVID-19 testing has been an important part of the response and our ability to manage the pandemic. Testing behaviours vary both across the time of day and day of the week, with these patterns having important implications for detecting positive cases of COVID-19. Such data insights are valuable for refining our approach and supporting the responses to the COVID-19 pandemic.
Notes
1. More information about Local Data Spaces can be found here https://data.cdrc.ac.uk/stories/local-data-spaces-supporting-local-autho.... The Local Data Spaces team includes Simon Leech, Mark Green, Jacob Macdonald and Maurizio Gibin from the CDRC.
2. The total NHS Test and Trace dataset between 1st January 2020 and 8th April 2021 was 89,519,184. 25,163,449 of these 89,519,184 records (28%) were recorded at hour 0. We believed these values were primarily used as a missing value, when the test date is known but not the time. This problem seems to have begun in January 2021, perhaps linked to lateral flow test at home or educational settings. Data with the hour 0 was thus removed from our analysis, assumed missing at random. The final dataset used for this analysis contained 64,352,735 COVID-19 test records.