
You are here
Who gets tested when providing free lateral flow tests to a city?
One of the main issues limiting our ability to manage the COVID-19 pandemic has been the difficulty in monitoring the spread of COVID-19 among people without symptoms (i.e., asymptomatic). While individuals with symptoms may socially distance, self-isolate or could access testing, individuals can be infectious before they develop symptoms or may never develop symptoms.
On 6th November 2021, the UK Government piloted offering free lateral flow tests to asymptomatic individuals. The pilot was trailed in Liverpool, which at the time had the highest number of infections in the UK. The aim was to catch cases of COVID-19 early and break chains of transmission.
The pilot was unprecedented at the time. We simply did not have any evidence over whether trying to test an entire city for COVID-19 would work. Evidence from the pilot would go onto to inform the national roll-out of lateral flow testing helping to re-open workplaces and schools following the January national lockdown.
Researchers from the CDRC supported the design and evaluation of this pilot. In newly published research, we showed the extent of inequalities in who got tested and who did not during the pilot.
A popular pilot
The response in Liverpool towards getting tested during the ‘mass testing’ pilot was brilliant and interest continued post pilot. 43% of residents in Liverpool, or 214,525 people, got tested between 6th November 2020 and 31st January 2021. These figures have continued to rise since February as well, with many people becoming repeat testers.

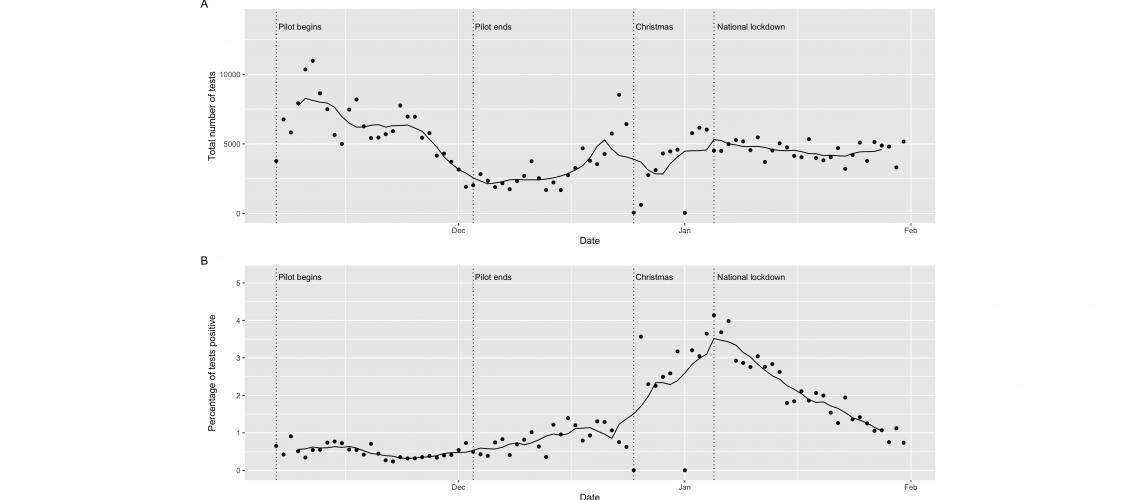
Plot 1: Trends in lateral flow test uptake and positivity rates (points are raw values, the line is the 7-day average).
Uptake was highest at the start of the pilot, before declining towards it’s end (see Plot 1). Liverpool City Council’s decision to continue making free asymptomatic lateral flow testing to people in Liverpool saw increasing uptake in December and was most popular in the run up to Christmas as people sought tests before seeing friends and family. Testing remained popular into the January national lockdown.
Testing found 5192 individuals who did not know they had the virus and were notified of the need to self-isolate within an hour, potentially breaking chains of transmission. In particular, trends in positive tests were highest in early January 2021 reflecting the increased transmission of the variant originating in Kent (see Plot 1).
Inequalities in who got tested
While testing was popular overall, there were important differences in who got tested and who did not. Males, people from the most deprived areas and Black, Asian and other non-White ethnic groups all had lower uptake.
Each of these groups were also more likely to have tested positive over the period as well, suggesting that those communities who were less likely to have engaged with the pilot were more likely to have benefitted from it.
COVID-19 has amplified social and health inequalities, and the experiences of the pilot in Liverpool seemed to mirror those inequalities.
Mapping to understand
Geography is the lens at which we view the World. Where spatial patterns exist, they often give us a clue to the underlying processes.
We mapped overall uptake for neighbourhoods in Liverpool to try and better understand who got tested. There were distinct geographical patterns with lower than expected uptake in densely populated and highly deprived communities in North Liverpool (see Plot 2). This contrasted with higher uptake in those more affluent suburbs in South Liverpool.

Plot 2: Mapping the predicted ratio (relative risk) of observed number of tests versus expected (based on an area’s population profile) number of tests. A value above 1 means more tests than expected, with a value below 1 meaning fewer tests than expected.
The power of mapping allowed us to compare uptake patterns to geographical data on local populations to see if uptake was higher or lower among certain communities.
Socioeconomic deprivation was an important factor in understanding test uptake patterns, with uptake lower in the most deprived areas. It highlighted the importance of providing sufficient financial support to allow low-income groups to isolate so that they feel comfortable getting tested.
Similarly, mapping accessibility to test sites was useful in identifying areas with poor accessibility, comparing how access relates to uptake, and proactively identifying locations to open new test sites to tackle these gaps. We estimated that for each additional 1 km distance communities were located away from their nearest test site, uptake fell by 5%. Making testing easy to access and walkable was a key lesson learnt.
Using the CDRC’s Internet User Classification, we found that communities less confident in using internet technologies also had lower uptake. While non-digital routes to get tested existed, people were primarily expected to register using their smart phones and received results by text. Our findings showed the importance of ensuring non-digital routes for testing, as well as communicating the benefits of the pilot beyond the internet.
You can read the full paper here:
Green MA, García-Fiñana M, Barr B, et al. 2021. Evaluating social and spatial inequalities of large scale rapid lateral flow SARS-CoV-2 antigen testing in COVID-19 management: An observational study of Liverpool, UK (November 2020 to January 2021). The Lancet Regional Health – Europe 6: 100107. https://www.thelancet.com/journals/lanepe/article/PIIS2666-7762(21)00084-3/fulltext