
You are here
Mapping Inequalities in COVID-19 Vaccine Accessibility
Successful roll-out of COVID-19 vaccines requires complex logistical delivery to help ensure everyone can receive their dose. England has established over 1700 vaccination sites distributed across the country to help provide vaccines to the population. Excellent progress has been made so far with over 95% of eligible people having received their first dose. Despite this, there are concerns that gaps in the location of vaccination sites may limit the opportunity for equitable uptake in certain communities.
This blog explores the distribution of vaccination sites across England to identify if it is an important factor in explaining vaccination uptake.
Measuring Accessibility to vaccination sites
We used open data on the location of vaccination sites on the 26th of March 2021 from NHS England. There were a total of 1753 sites across England. The NHS notes that 99% of the population live within 10 miles of their nearest vaccination site.
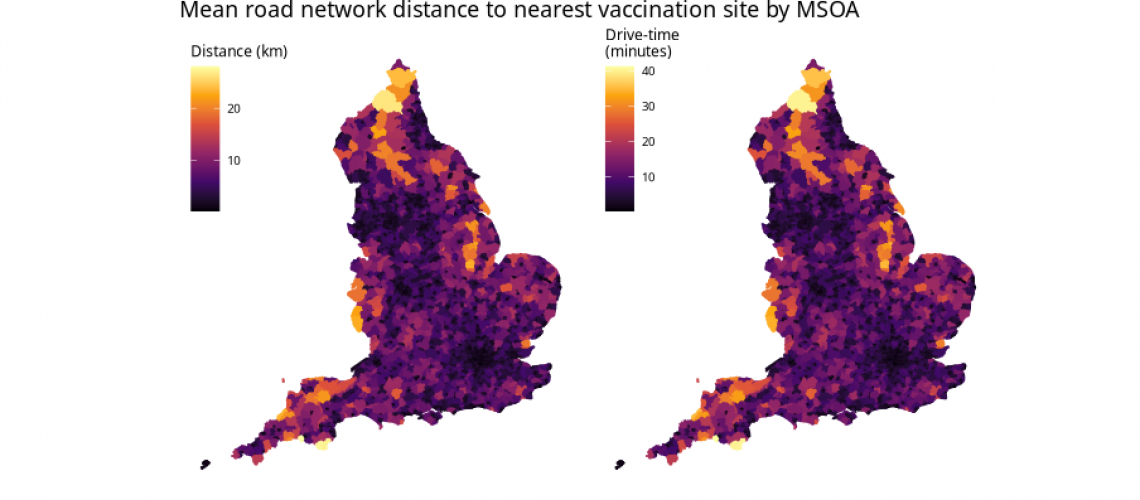
We measure accessibility through estimating the time-weighted road network distance of each postcode in England to its nearest vaccination site. We then calculate the average for MSOAs (Middle Super Output Areas), equivalent to large neighbourhoods within towns or cities (average population size ~7000 people).
The map below shows accessibility to the nearest vaccination sites for England. As expected, accessibility is best in urban centres where the average drive-time to the nearest vaccination site is often <2 minutes, around 1 km on urban roads. In contrast, the largest travel times were in remote rural areas where access was poorest. Here, residents could often have to travel more than half an hour or over 20 km to access their nearest vaccination site. This suggests that the ‘as the crow flies’ metric to establish accessibility, used by the NHS to suggest that 99% of people in England live within 10 miles of their nearest vaccination site, may not suitably account for the true distance required to travel for the most remote populations. By our calculation 1.73% of postcodes in England are over 10 miles (~16 km) from their nearest vaccination site, with the most remote postcodes up to 57 km away by road. This may be particular issue for those who are unable to drive or may be avoiding public transport due to the pandemic; those who are the most important to get vaccinated.

Does accessibility matter for understanding uptake?
We next compare our accessibility data to data on vaccination uptake from NHS England for the 1st of April 2021. As of this date, all people over 50 years old and the clinically vulnerable were eligible for a coronavirus vaccine dose. For this reason, we focus just on adults over 50 years old. We also use data on population estimates from ONS.
The following map shows the percentage of the population that received their first dose. The majority of MSOAs (85.4%) have an estimated uptake >90% reflecting the success of the vaccination roll-out. However, there are some geographical inequalities with areas in the north of England and towards Wales that were previously shown to have poorer accessibility also having lower uptake. Interestingly there are also lower levels of vaccination uptakes in over 50s in some urban centres, particularly in and around London.

There appear two key groupings for those areas with lower than average uptake. Urban centres, where access is widely available, and the most remote areas where access is very poor. The high drive times that appear with these remote areas may be a barrier for uptake, reflecting isolated communities who are unable or discouraged to make this journey. The disparity within urban centres is likely to represent very different drivers, including poorer uptake among marginalised and ethnically diverse populations that Local Authorities are working hard to support.
Overall it appears that poor access to vaccination sites may affect vaccination uptake for only the most extreme examples. Poor uptake in urban centres presents an equally worrying issue, that requires further analysis. All the code and data to replicate our analyses can be found on GitHub.
Work completed by Cillian Berragan, Mark Green and Alex Singleton.