
You are here
Lockdown guidelines exposed socio-spatial fragmentation
In this study, we used data on human mobility to explore the activity patterns in the neighbourhoods of Greater London as they emerged from the first wave of national lockdown measures in summer 2020.
The anonymised smartphone location data applied in this study are provided by Huq Industries. The sample data used in this research was aggregated through 146 apps from over 300 000 unique devices and is spatially aggregated into 1 km2 grid cells covering the Greater London area so that no individual trajectories can be detected.
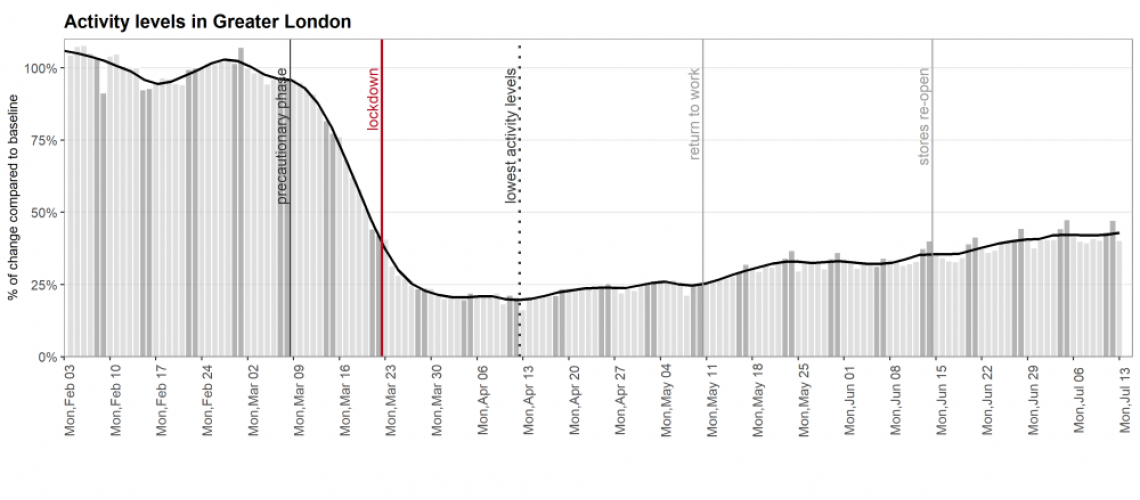
The data show that the activity levels in Greater London started to significantly decline in week 10 (09th-15th March 2020) and by the time the lockdown was announced on Monday 23rd March 2020, the activity levels were already down by 56% compared to Monday 09th March. The steep decline in activities slowed down after one week of nationwide lockdown and the decline continued at a slower pace until reaching the lowest levels during week 16 (13th-19th April) when they were down by over 84% compared to the pre-lockdown activity levels. The activity levels started to slowly recover in mid-April and recovered to 47% of pre-lockdown levels by the beginning of July.

As part of our analysis, we compare the temporal patterns in the Huq activity data to various other activity metrics made available by Google and Apple in their respective ‘Mobility Reports’. The hierarchical clustering results show that trends in our sample data are similar to the other activity metrics that represent the mobility of the ambient population in Greater London.
In the second part of the study, the aim was to identify socioeconomic characteristics that could explain the differing rates of decline in neighbourhood activity volumes. We added contextual information that indicates the social, economic, and demographic characteristics of a neighbourhood to the mobile locations data and run a segmented regression analysis to evaluate disparities between geodemographic classification types in different periods during the lockdown.
Our analysis revealed the division between areas dominated by white- and blue-collar jobs, the latter showing a much smaller reduction in activity during the lockdown. This highlights a divide between those in jobs that can be done from home and those with jobs that must be carried out on-site, with activity levels suggesting that those working in financial services, in particular, are in a better position to work remotely. This will have important implications for transport planning and retailers as staggered working hours mixed with homeworking where possible have drastically reduced demand in certain neighbourhoods. Comparison between different types of retail centres showed less reduction of activity levels at the Local Retail & Service Centres; whereas the activity levels dropped as much as 70 % in Leading Comparison & Leisure Destinations located commonly in dynamic central locations. The findings suggest that the challenges faced by traditional high streets and leisure centres will be very different, and local trading patterns may depend upon behaviours developed during the lockdown period (e.g. more people will be working from home) as well as from further regulations (e.g. local lockdowns, travel restrictions).
Read the accompanying article on Urban Studies OnlineFirst here.